|
WrightZone Weighbridge Software Manual
|
|||||
|
|||||
|
Copyright© WrightZone Limited 2016
|
|
WrightZone Weighbridge Software Manual
|
|||||
|
|||||
|
Copyright© WrightZone Limited 2016
|
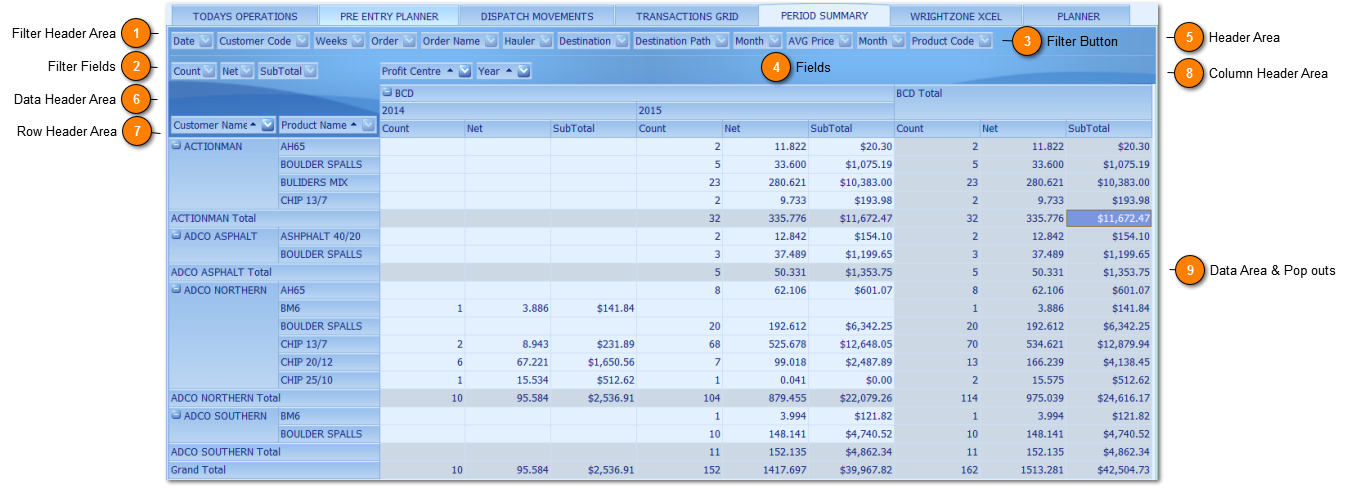
Filter Header Area
The Filter Header Area displays the headers of all the visible filter fields. The filter header area Separator borders this area from the rest of the grid control.
|
Filter Fields
Filter fields are located in the pivot grid's filter header area. Filter fields allow users to apply a filter to the entire PivotGrid control to display data for specific values. Users can specify the filter criteria using the filter dropdown window which is invoked by clicking the filter button. To further filter the data displayed within the data area, users can apply filter criteria to the field values of column fields and row fields.
 |
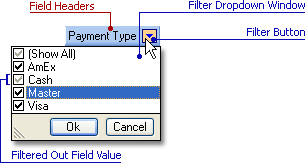
Filter Button
Filter buttons are displayed within field headers and can be clicked to invoke the filter dropdown window. This window allows users to filter the data by selecting the field values which will be included in the resulting data subset to calculate summaries.
 |
Fields
A Field is a subset of data passed as a source from your WZWB database to a pivot grid. A field provides values that the pivot grid uses to build a report; create its layout, filter data, and calculate summaries.
In the pivot grid, a field is represented by a field header. All user operations with a field (such as layout customization, filtering and sorting data, etc) can be carried out using the corresponding field header.
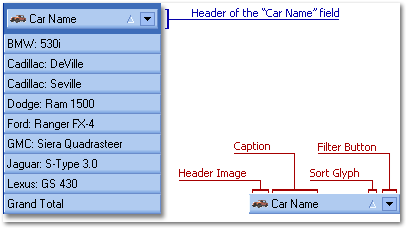
Field Headers contain:
Headers of all the visible fields are contained within the following header areas:
|
Header Area
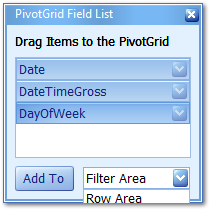
The Header area offers users all the fields available for selection with which to populate the content of your pivot grid.
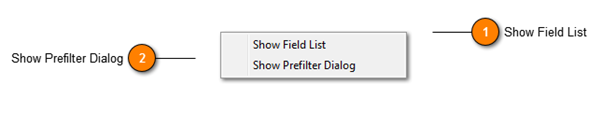
Show Field List opens the pivot grid customization form and offers a view of set hidden fields within your pivot grid. The Dispatch Grid has a few of these (below).
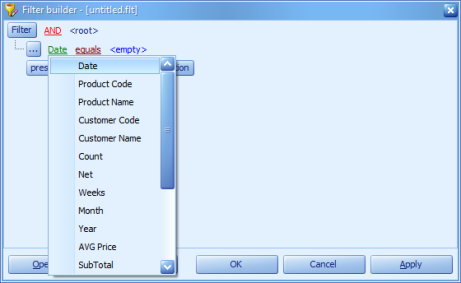
Show Prefilter Dialog offers advanced grid customisation for any field using the grid filter builder functionality.
 |
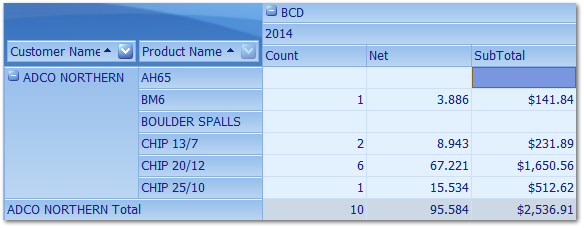
Row Header Area
The Row Header Area is defaulted and pre-populated based on common client requirements for each WZWB pivot grid, displaying user selected row header fields.
|
Column Header Area
The Column Header Area is defaulted and pre-populated based on common client requirements for each WZWB pivot grid, displaying user selected column header fields.
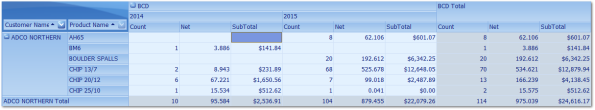
A pivot grid column header area that has more than one column field will have the innermost column field (Profit Centre, below) and any other column fields are referred to as outer column fields. Values of the outermost column field (Year, below) are displayed only once while values of the rest of the column fields can be repeated.
|
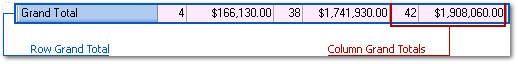
Data Area & Pop outs
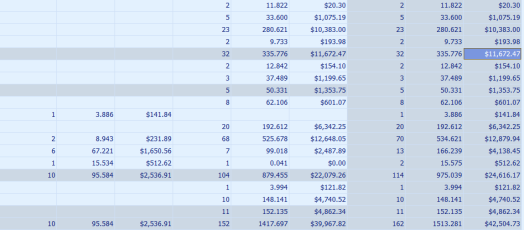
Data Cells are located in the data area of the pivot grid. Data cells display Cross Cells, Total Cells and Grand Total Cells. Cross cells display summary values which have been calculated for row and column fields.
Each cross cell displays a summary calculated against a data field for a subset of records stored in your WZWB database. All records from this subset have matching values in a column fields and row fields and these values are identified by column and row headers.
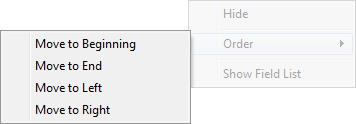
Pivot Grid Pop outs
There are multiple Pop outs accessed via right click within the pivot grid with options varied based on the fields existing within the Data, Row and Column Header sections of the grid.
All Pop outs should be self explanatory hence here we discuss the two most common employed by WZWB users.
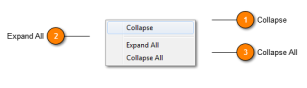
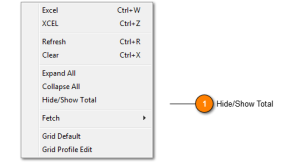
The Main Pop out (above) offers one further settings from that of the standard UI Pop outs being Hide/Show Total which delivers a functional option when looking at smaller data sets to remove subtotal values for the innermost Row Header field.
|